Forget ordinary altcoins, Solana (SOL) and Avalanche (AVAX) are powerhouse Layer-1 blockchains fueling the rise of DeFi, NFTs, and blockchain gaming.
But here’s what keeps traders and analysts hooked: the Solana Avalanche Correlation. Sometimes these two coins move almost in sync, rising together in bullish waves. Other times, their paths split, creating unexpected trading windows.
Understanding the solana avalanche correlation matters because it isn’t just a chart pattern. It’s a key to spotting profit opportunities, managing risk and predicting where the market might turn next.
Now, here’s where it gets tricky. Correlation isn’t just about saying “these coins move the same way.” It’s about asking deeper questions:
- Is Solana’s bullish outlook tied to Avalanche’s momentum or do they break off when big news hits?
- Could a correlation prediction actually guide trading strategies?
- And most importantly, can ordinary investors use this to find profit opportunities without needing a PhD in statistics?
That’s what this article tries to unpack.
The Solana Avalanche behind correlation
Let’s pause for a second. Imagine you’re checking Solana daily analysis and you see a solana signal flashing bullish. Great. But what if Avalanche’s technical market indicators point the other way? That tension of almost uncomfortable divergence, is what makes correlation worth studying. Because sometimes, spotting those mismatches can mean catching a move before everyone else notices.
And it’s not all theory either. Historical prices show that during the 2021 bull run, SOL and AVAX often shared momentum. Fast forward to the 2022 crash and the correlation shifted, sometimes dramatically. Post-FTX collapse recovery? Another story. A drawdown chart or even a rolling correlation line can reveal how fragile or how tight that connection really is.
Why this matters for you
If you’re an investor, ignoring correlation is like driving blindfolded. You may think you’re diversified because you hold both SOL and AVAX but if their moves are tied too closely, your portfolio optimizer may not be giving you the protection you expect. On the flip side, if you understand when their relationship weakens, you might catch arbitrage opportunities or rebalance at a level for confirmation before others even realize.
And for traders… Well, this is where it gets fun. Solana to Avalanche on Binance Futures is a popular trading pair for a reason. Watching their correlation can help with asset allocation, risk-free rate adjustments, even planning around additional volatility levels. Some folks even build AI trading agents to track these things automatically.
What’s coming in this breakdown
So, here’s what you’ll find as you keep reading:
- A plain explanation of what correlation really means in crypto and how it compares to traditional finance.
- A closer look at Solana’s story, its Proof of History system, its strengths, its outages and how investors feel about it.
- A dive into Avalanche, from its subnet system to AVAX price pumps and why institutions like it.
- Historical comparisons including those wild 90-day periods where the relationship between SOL and AVAX flipped on its head.
- Tools, metrics even a converter table of popular conversion amounts and exchange fees that help you make sense of the numbers.
- Practical trading and investment strategies that rely on the solana avalanche correlation prediction, not just guesswork.
And yes, I’ll try to keep it realistic. This isn’t financial advice, of course. Just one more voice in the ongoing conversation about how to handle two of crypto’s most interesting players.
Quick pro tip
Before diving deeper, here’s a small pro tip: if you’re actively tracking correlation between Solana (SOL-USD) and Avalanche (AVAX-USD), don’t just look at their daily candles. Plot a rolling correlation chart over 30-, 60- and 90-day periods. Sometimes, the short-term noise hides what the long-term pattern is quietly screaming.
By the end of this article, you’ll have a comprehensive overview of why the Solana avalanche correlation isn’t just a nerdy statistic, it’s a practical lens to spot profit opportunities. Whether you’re looking at a descending wedge pattern on Solana, comparing AVAX data across exchanges or even exploring quirky community-driven projects like the RebelSatoshi platform’s Unlock War, the way these two assets move in relation to each other matters.
And maybe, just maybe, understanding that relationship will make the next solana coin price prediction today feel a little less like guesswork… and a little more like strategy.
Understanding Crypto Correlations
You hear the word “correlation” tossed around a lot in finance but in crypto, it takes on a whole different flavor. Some people think of it as just a fancy way of saying “two prices move together.” That’s not wrong… but it’s also not the full story. Correlation is less about one coin copying the other and more about how their paths intertwine.
Take Solana and Avalanche. On paper, both are fast Layer-1 blockchain platforms competing for the same space, DeFi apps, smart contract ecosystems, even niche areas like game transactions. So of course, their markets sometimes echo each other. But correlation shifts. It strengthens in times of shared excitement (a bullish outlook across altcoins) and weakens when one network hits an outage or some sudden AVAX price pumps distort things.
If you’re trying to decode the Solana avalanche correlation, you have to step back and ask: what does correlation actually mean here, and how is it measured?
A quick definition
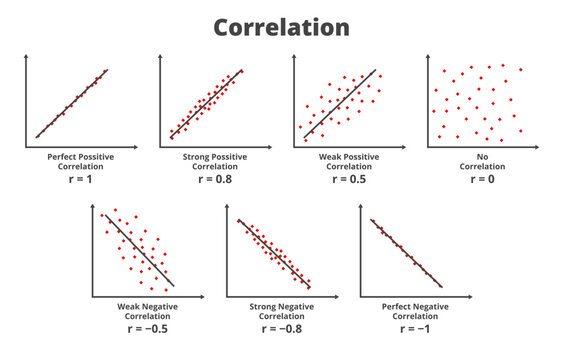
In the simplest terms, correlation is a statistical measure of how two assets move in relation to one another. It ranges between -1 and +1:
- +1 means they move perfectly together. If Solana climbs, Avalanche climbs in almost the same way.
- 0 means no relationship. One can go up while the other drifts sideways.
- -1 means they move in opposite directions. One rises while the other falls.
It sounds neat and tidy, but the crypto world rarely behaves so neatly.
Correlation in traditional finance vs crypto
In traditional finance, you often see correlations between stocks in the same sector or between bonds and equities (sometimes negative, sometimes not). Traders rely on these patterns for asset allocation, portfolio optimizers, even risk-adjusted metrics like the Sharpe Ratio.
Crypto, though, has quirks:
- Market sentiment drives huge swings. If Bitcoin sneezes, the rest of the market catches a cold.
- Liquidity can distort things. Lower liquidity in AVAX data or certain trading pairs makes correlations look stronger or weaker than they really are.
- Macroeconomic events, inflation data, interest rate announcements or global regulations, often pull the whole crypto sector into the same tide, making correlations spike artificially.
- Network-specific issues can break the rhythm. For Solana, outages have caused sudden divergence. For Avalanche, the competition with Ethereum or scaling bottlenecks can do the same.
So unlike traditional finance, where correlations might hold steady, in crypto they wobble. They breathe. Sometimes they vanish when you need them most.
Factors that drive correlations in crypto
Let’s break it down a bit more clearly. The solana avalanche correlation (and really any crypto pair) tends to be shaped by these drivers:
- BTC dominance: When Bitcoin leads, altcoins often follow, tightening their correlations.
- Liquidity flows: Capital moving into Solana in Avalanche or Solana to Avalanche on Binance Futures creates artificial links.
- Investor behavior: Retail traders often lump “Layer-1 projects” together, so their buys and sells affect SOL and AVAX simultaneously.
- News & sentiment: Regulatory headlines, partnerships or rumors spread fast, lifting or sinking both coins.
- Technology updates: Solana’s Proof of History improvements or Avalanche’s subnet expansions can tilt investor attention.
A quick table view helps visualize these drivers:
| Factor | Impact on Solana | Impact on Avalanche | Effect on Correlation |
| BTC dominance | Increases SOL’s alignment with market trend | AVAX follows BTC similarly | Correlation strengthens |
| Liquidity shifts | High volume in SOL-USD pairs | AVAX-USD volume reacts slower | Correlation weakens temporarily |
| Retail sentiment | Tends to lump SOL with “ETH killers” | Same basket effect for AVAX | Correlation strengthens |
| Network issues | SOL outages disrupt flows | AVAX may rise by contrast | Correlation weakens |
| Regulatory news | Impacts Layer-1s broadly | Similar reaction pattern | Correlation strengthens |
Notice how fluid it is. Sometimes both coins ride the same wave, other times one coin’s stumble becomes the other’s edge.
Measuring correlation
Alright, here’s where it gets a little more technical. Traders don’t just guess correlation. They measure it using different tools:
- Pearson coefficient: The classic method. It checks linear relationships, giving a number between -1 and +1.
- Spearman’s rank correlation: Looks at ranking instead of raw values. Useful when data isn’t normally distributed (and crypto rarely is).
- Rolling correlation: Probably the most practical. You measure correlation over moving windows, say 30 day or 90 day periods. That way, you see when the connection is strong and when it fades.
- Custom crypto metrics: Some platforms add volatility levels, Standard Deviation or drawdown chart overlays to track how risk changes correlation strength.
Here’s a small example scenario:
If Solana price prediction today shows bullish momentum while Avalanche’s historical prices trend sideways, Pearson correlation for the past 30 days might fall closer to 0. But look at the 90-day period? You might still find a solid positive trend, suggesting the current divergence is temporary.
Why correlation matters in practice
So, why should you care about all this math? Because real money is at stake. A few points to consider:
- Portfolio risk: If SOL and AVAX move in sync, holding both isn’t true diversification. Your Standard Deviation and drawdowns rise together.
- Trading signals: A solana signal pointing bullish means more if Avalanche shows confirmation. If not, maybe that signal is weaker than it looks.
- Arbitrage & pairs trading: If correlation weakens temporarily, you might long one and short the other, catching profit when they snap back in line.
- Investor psychology: On forums like solana avalanche correlation reddit, people often notice patterns before the data confirms them. Sometimes, that chatter is the early smoke before a fire.
Pro tip
Don’t just rely on one metric. If you only look at Pearson correlation, you’ll miss non-linear relationships. Combine rolling correlation charts with volatility overlays. Even something as simple as a color plotting of Solana vs Avalanche on a 90-day rolling basis can highlight when the story is changing.
And here’s another small reminder: correlations are not static. They’re living, shifting and often misleading if you assume yesterday’s pattern will hold tomorrow.
By now, you’ve got a solid grounding in what correlation really means in the crypto world, how it’s measured and why it matters. Next, we’ll zoom in closer. Because before you can truly understand the solana avalanche correlation, you need to know the players individually. First up… Solana.
Solana Overview
When people talk about Solana, the conversation often swings between extremes. On one side, you’ll hear glowing praise: lightning-fast transactions, a thriving smart contract ecosystem and a decentralized finance playground where developers flock to build. On the other, critics bring up outages, technical hiccups and the nagging question of whether Solana can truly hold its ground against rivals like Ethereum or Avalanche. Somewhere in the middle lies the real story.
And honestly, that’s where things get interesting.
A brief history
Solana came onto the scene around 2020, but its roots trace back to 2017, when Anatoly Yakovenko introduced the concept of Proof of History (PoH). The idea was deceptively simple: instead of relying only on consensus like other blockchains, Solana would add a cryptographic clock to keep order. This innovation aimed to solve one of crypto’s most annoying bottlenecks.
Fast forward, and Solana positioned itself as a high-performance Layer-1 blockchain. By 2021, during the bull market, SOL-USD was riding high, powered by DeFi apps, NFT projects and even gaming experiments. Investors were quick to notice and institutions started dipping their toes in.
But 2022 hit hard. Network outages, the FTX collapse and waves of bearish sentiment dragged Solana down. And yet, despite setbacks, the ecosystem didn’t vanish. If anything, it’s grown more battle-tested.
The core technology
At the heart of Solana is Proof of History combined with Tower BFT (Byzantine Fault Tolerance). The result? Block times as fast as 400ms and theoretical throughput of over 65,000 transactions per second. Compared to other Layer-1 blockchains, that’s staggering.
Solana’s strengths:
- Speed and scalability: Near-instant finality, low fees, fast settlement.
- Developer activity: A broad range of dApps, from DeFi protocols to NFT marketplaces.
- Ecosystem diversity: From AI trading agents to quirky projects like the community-driven RebelSatoshi platform and its Unlock War campaign.
Weaknesses, though, are part of the story too:
- Outages: Solana has suffered multiple downtime events, raising questions about reliability.
- Centralization concerns: While marketed as decentralized, some argue validator requirements skew toward big players.
- Competition: Ethereum’s Layer-2 solutions and Avalanche’s subnet design both challenge Solana’s edge.
Market adoption
Despite its issues, Solana remains a convenient option for many. Developers building DeFi apps like it because of low transaction costs. NFT creators love the throughput, minting large collections without gas wars. Even gaming projects experiment with Solana because fast transactions make game mechanics smoother.
Here’s a snapshot of adoption highlights:
| Sector | Solana’s Role | Notes |
| DeFi | Lending, staking, decentralized exchanges | Popular for low fees, though liquidity can be volatile |
| NFTs | Platforms like Magic Eden | High transaction throughput supports mass minting |
| Gaming | On-chain game transaction | Experiments ongoing, still early stage |
| Institutions | Selective interest | Some hedge funds test Solana exposure, but cautious after outages |
Investor sentiment has been mixed. On one hand, Solana daily analysis often points to promising technical setups, such as descending wedge patterns that hint at recovery. On the other hand, Solana coin price prediction today varies depending on who you ask. Some traders see bullish signals, while skeptics highlight critical levels that need confirmation.
Solana in the numbers
Let’s be realistic: no overview is complete without looking at the metrics that traders care about. Technical market indicators often drive short-term decisions, while broader adoption shapes the long-term outlook.
A few notable data points:
- Current price & volatility: SOL tends to swing heavily, with additional volatility levels that keep both day traders and long-term investors cautious.
- Sharpe Ratio: When compared against rivals like Avalanche, Solana’s Sharpe Ratio has fluctuated. During bullish trends, it shines. During bearish drawdowns, it falters.
- Trading pairs: Solana to Avalanche on Binance Futures has become a watchpoint, as correlation traders look for inefficiencies.
It’s in these numbers that the solana avalanche correlation becomes tangible. Sometimes both assets climb together, sometimes one lags. Traders often check historical prices and overlay a drawdown chart to see whether the relationship is tightening or loosening.
Pro tip
If you’re tracking Solana closely, don’t just stop at the price chart. Use a converter table from popular cryptocurrency exchanges to see how SOL compares against AVAX in different trading pairs. Exchange fees and even lowest exchange rate spreads can affect your portfolio optimizer more than you think. Sometimes, what looks like a small inefficiency is actually a chance for arbitrage.
Strengths vs weaknesses, simplified
Here’s a quick comparison table of Solana’s pros and cons, from an investor’s perspective:
| Strengths | Weaknesses |
| High scalability & speed | Network outages undermine confidence |
| Strong DeFi & NFT adoption | Concerns about centralization |
| Growing institutional curiosity | Fierce competition from AVAX, ETH, others |
| Low transaction costs | Volatility makes predictions tricky |
Investor outlook
So where does this leave Solana today? Somewhere in the middle of promise and uncertainty. On forums and analysis blogs, solana price prediction today often sparks debate. Bulls point to its technical foundation and recovering community. Bears argue that outages and competition will keep it from scaling into the future.
What feels true is this: Solana has earned its spot in the top tier of Layer-1s. It’s not just hype. The smart contract ecosystem, combined with real adoption in DeFi and NFTs, gives it staying power. But whether that translates into consistent growth… that’s harder to say.
Some investors use Solana primarily as a diversification tool against Ethereum and Avalanche. Others see it as an aggressive bet with high risk and potentially high reward. A few even mix in AI trading agents or portfolio optimizers that weigh Solana alongside Avalanche data for better asset allocation.
And in terms of correlation? Solana rarely moves alone. Its story intertwines with others, especially Avalanche. Which is exactly why we can’t talk about Solana without looking at AVAX next.
Avalanche Overview
Avalanche is one of those projects that seems to appear in every “Ethereum killer” conversation, right alongside Solana. It has this reputation for being both technically impressive and a little underappreciated… until it isn’t. When momentum shifts, you suddenly hear about AVAX price pumps, partnerships or a new DeFi protocol launching on its subnets. Then it drifts into the background again while other Layer-1 blockchains steal the spotlight.
And yet, Avalanche keeps moving forward.
Origins and early growth
Avalanche launched in 2020, founded by Emin Gün Sirer and the Ava Labs team. Its central promise was speed, security and flexibility, but with a twist. Instead of building just one chain, Avalanche introduced a multi-chain approach with subnets, customizable blockchains that can be optimized for different use cases.
This architecture was a response to the scalability challenges faced by Ethereum and others. Rather than pushing everything through a single Layer-1, Avalanche offered parallel highways. That idea resonated with developers, and adoption followed.
By late 2021, Avalanche was a hot topic. Institutions noticed, retail traders poured in and its AVAX-USD price surged. The hype cooled during the 2022 crash, but the foundation remained solid.
The core technology
Avalanche’s consensus mechanism is its crown jewel. Unlike Proof of Work or Proof of History, Avalanche uses a family of consensus protocols that rely on repeated subsampling and voting. It sounds technical (because it is), but the result is faster finality, lower energy use, and high scalability.
Some highlights of its design:
- Subnets: Developers can spin up dedicated blockchains tailored to specific apps. Think DeFi ecosystems, gaming platforms, even enterprise use cases.
- C-chain, P-chain, X-chain: Avalanche separates contract execution (C), platform governance (P) and asset transfers (X), which helps distribute workload.
- Compatibility: EVM-compatible, making it easier for Ethereum-based projects to migrate.
That flexibility is part of why Avalanche found a niche in both decentralized finance and gaming.
Market use cases
Avalanche may not dominate headlines daily, but its ecosystem is quietly broad.
| Sector | Avalanche’s Role | Notes |
| DeFi | Lending, AMMs, derivatives | Popular among yield seekers; integration with multiple exchanges |
| Gaming | Subnets support game transactions | Some experiments show promise, but competition is fierce |
| Institutions | Experimenting with AVAX subnets | Financial institutions test tokenized assets |
| NFTs | Less dominant than Solana | Some niche projects, not mass adoption yet |
Interestingly, Avalanche often positions itself as a convenient option for builders who want customization. Developers who feel restricted by Solana or Ethereum sometimes shift here.
Strengths and limitations
Strengths first:
- Scalability: Subnet architecture allows near-infinite scaling if adoption grows.
- Low fees: AVAX transactions are cheaper than Ethereum gas.
- Institutional curiosity: Institutions like its tokenization and asset transfer options.
- Community-driven growth: A vocal community, though smaller than Solana’s.
Limitations, though, are worth noting:
- Competition: Ethereum dominates DeFi; Solana leads NFTs. Avalanche must carve its niche.
- Liquidity: AVAX data shows thinner liquidity compared to SOL, ETH, or BTC.
- Adoption gaps: While subnets are powerful, mainstream adoption is slower than expected.
- Market cycles: AVAX price pumps often fade, raising questions about sustained momentum.
Technical and investor outlook
From a trading perspective, Avalanche is both exciting and tricky. Its current price swings make it attractive for short-term traders. Solana avalanche correlation prediction models often highlight AVAX as more volatile, meaning it can amplify both risk and reward.
Key technical points often tracked by traders:
- Standard Deviation: AVAX tends to show higher variance than SOL in 90-day periods.
- Critical levels: Breakouts above descending wedge patterns have historically triggered sharp rallies.
- Correlation with Solana: During strong market sentiment, the solana avalanche correlation strengthens, especially when both coins ride BTC’s positive trend.
Pro tip
If you’re following Avalanche closely, don’t ignore exchange dynamics. Sometimes the lowest exchange rate or higher exchange fees on smaller cryptocurrency exchanges can distort short-term AVAX data. Watching a converter table of popular conversion amounts (for example, SOL to AVAX vs AVAX to USD) gives a more grounded view than just staring at candlesticks.
Strengths vs limitations at a glance
| Strengths | Limitations |
| Flexible subnet design | Slower mainstream adoption |
| Low fees | Liquidity gaps |
| EVM compatibility | Stiff competition from SOL, ETH |
| Institutional interest | Price volatility and sustainability concerns |
Community and sentiment
Like Solana, Avalanche thrives on community buzz. On forums and solana avalanche correlation reddit threads, you’ll often see traders debating whether AVAX is undervalued compared to SOL. Some point to its subnet potential as the long-term driver, while others worry that without a stronger NFT or gaming ecosystem, it will remain second-tier.
Investor behavior reflects that split. Portfolio optimizers sometimes include Avalanche alongside Solana to diversify Layer-1 exposure. But risk managers warn that because of correlation, holding both may not reduce volatility as much as it seems.
Where Avalanche stands today
Avalanche feels like it’s in a transition stage. Its technology is solid, its vision ambitious, but its adoption curve is uneven. Still, that’s part of what makes studying the solana avalanche correlation so useful. Because when one asset’s momentum dips, the other often reacts, sometimes in sync, sometimes in contrast.
And that contrast? That’s where traders often find opportunity.
Historical Correlation Between Solana & Avalanche
Correlation is one of those things that only makes sense when you look back first. At the moment, markets feel noisy… unpredictable… even random. But when you chart the solana avalanche correlation over months or years, patterns start to surface. Sometimes faint, sometimes bold but always telling.
And if you’ve ever hung around solana avalanche correlation reddit discussions, you know traders obsess over these timelines. Because spotting when correlations tighten or break apart can mean the difference between catching a trend early or chasing shadows.
A story told in market cycles
To really understand this relationship, you have to break it down by cycles: the roaring 2021 bull run, the painful 2022 crash and the uneasy recovery after the FTX collapse.
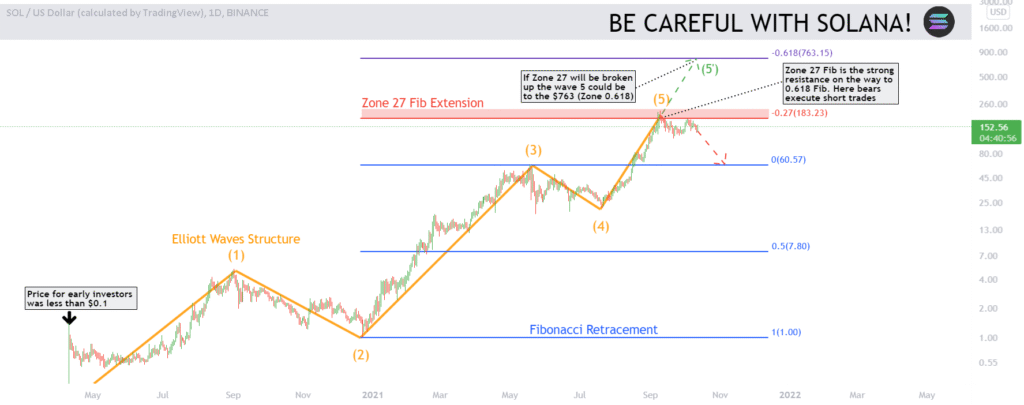
1. The 2021 bull run
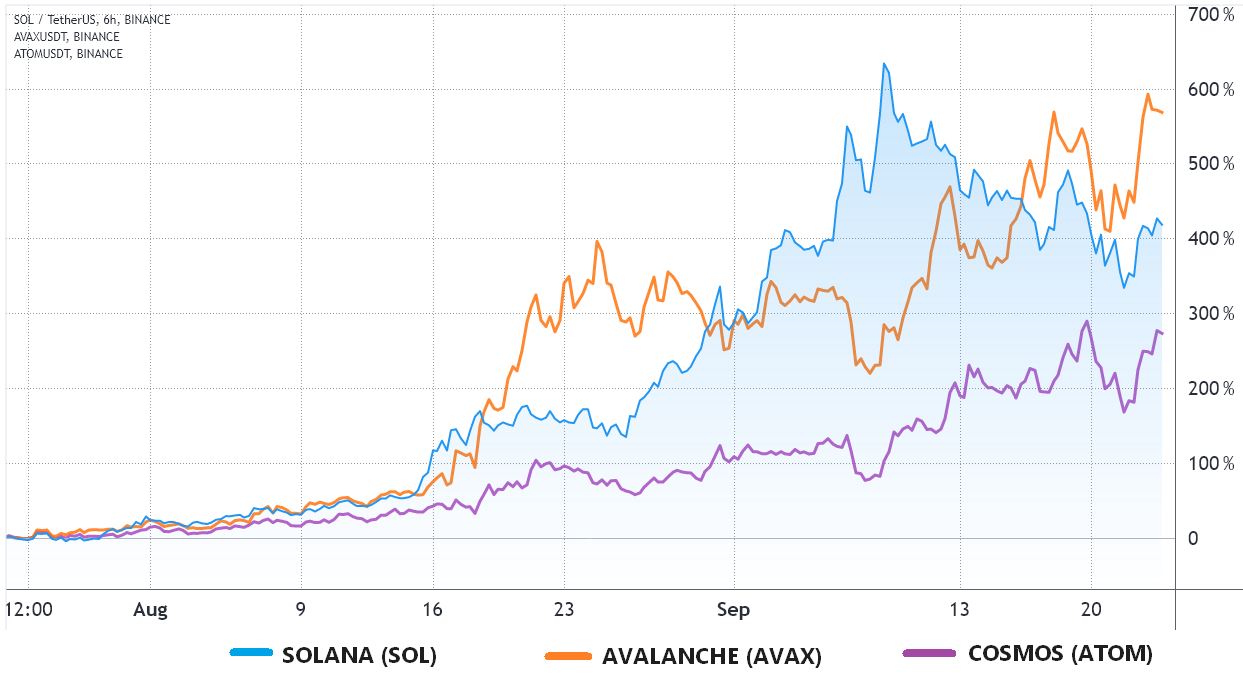
- Solana exploded onto the scene with NFTs and DeFi projects. AVAX wasn’t far behind, gaining traction with its subnets and DeFi ecosystem.
- During this phase, the correlation between SOL-USD and AVAX-USD was strongly positive. If you plotted a rolling 90-day correlation, it often hovered near +0.8.
- The bullish outlook for both projects was reinforced by institutional interest. Portfolio optimizers flagged both as growth assets, even if the Standard Deviation was high.
2. The 2022 crash
- This is where things diverged. As liquidity drained from the market, Solana suffered heavily from outages and FTX contagion. Avalanche also bled but in a slightly different rhythm.
- The correlation weakened at times, dipping below +0.5, especially during Solana-specific headlines.
- Traders using a drawdown chart could see that while both suffered, AVAX sometimes cushioned the blow when Solana dipped hardest.
3. Post-FTX collapse recovery
- By early 2023, both networks tried to rebuild trust. Solana worked on stability improvements, while Avalanche pushed subnet adoption.
- The correlation recovered somewhat, climbing back toward +0.7, but not as consistently as before. Solana signals sometimes hinted bullish while Avalanche lagged, creating windows for pairs trading.
What the numbers show
Correlation is best expressed with data. Here’s a simplified look at how Solana and Avalanche have moved together over different timeframes:
| Period | Correlation (approx.) | Notes |
| 2021 bull run | +0.75 to +0.85 | Both surged with altcoin hype |
| 2022 bear market | +0.4 to +0.6 | Correlation weakened, especially during SOL outages |
| Post-FTX recovery | +0.65 to +0.7 | Gradual recovery, but more fragile |
| 90-day rolling averages | Highly variable | Short-term noise often hides long-term trend |
What you notice is that correlation isn’t a fixed number. It breathes. And traders who relied too heavily on one snapshot often found themselves caught off guard.
Patterns inside the volatility
A few recurring themes show up when studying the solana avalanche correlation prediction across cycles:
- During strong BTC moves: Both coins tighten their relationship, following the market tide.
- During network stress events: Correlation weakens. Outages on Solana or liquidity issues on AVAX create divergence.
- During hype phases: NFT mania boosted Solana more than Avalanche, while institutional tokenization news lifted Avalanche more.
- Over 90-day periods: The broader trend often smooths out, showing the correlation is more resilient long-term than day to day fluctuations suggest.
Technical reflections
Some traders take it a step further by overlaying technical market indicators on correlation charts. For instance:
- Descending wedge patterns on Solana sometimes align with AVAX consolidations.
- Additional volatility levels for AVAX often widen the spread, but correlations snap back after breakouts.
- Level for confirmation becomes critical: if Solana breaks resistance while Avalanche lingers at support, that mismatch can be exploited with pairs trading.
And of course, statistical tools matter. A Pearson coefficient over 90 day windows gives one story. A Spearman rank test sometimes reveals subtler relationships, especially when volatility skews linear data.
Trader takeaways
So what does history suggest? A few lessons keep coming up:
- Diversification isn’t always real: Holding both SOL and AVAX didn’t protect investors in 2022. When the market sank, both bled, even if not equally.
- Opportunities live in divergence: When correlation weakens temporarily, arbitrage or hedging opportunities often appear.
- Correlation is cyclical: Don’t assume today’s strength will hold tomorrow. Always check rolling correlations, not static ones.
- Community insights matter: Sometimes, chatter on correlation reddit threads spots shifts before the data confirms it.
Pro tip
If you want to track the relationship in real time, plot a rolling 30-day correlation alongside a drawdown chart. The drawdown often shows stress points where correlation weakens and those are the very windows where strategies like long/short trades can shine. Bonus: color plotting Solana vs Avalanche prices over those same 30 days helps you see when they’re moving in step versus drifting apart.
Why it matters now
Looking at history doesn’t just satisfy curiosity. It sets the stage for what’s next. Solana avalanche correlation price prediction models often lean on these historical windows to project future behavior. Will correlation strengthen in the next bull run? Or will network differences finally push them further apart?
That’s the puzzle for traders and investors alike. History doesn’t guarantee answers… but it does hint at patterns worth watching.
Key Factors Influencing Solana Avalanche Correlation
If you’ve followed Solana and Avalanche long enough, you already know their prices don’t just move in isolation. There’s this invisible web of influences, some obvious, some subtle, that keeps tugging them closer together or pulling them apart. The solana avalanche correlation is really the sum of all those tugs.
And it’s messy. Sometimes predictable, sometimes totally baffling. Which is exactly why traders care.
1. Market-wide trends
The first and maybe the biggest driver is just the overall crypto tide. When Bitcoin or Ethereum shifts, everything else tends to follow.
- BTC dominance: In phases where Bitcoin takes up more market share, correlations across altcoins (SOL, AVAX included) tighten. A rising tide lifts all boats.
- ETH movements: Because both Solana and Avalanche position themselves as Ethereum competitors, when ETH gains or loses momentum, they often react in parallel.
- Macro events: Inflation data, rate hikes, or global regulatory updates affect the whole space. The correlation between SOL-USD and AVAX-USD usually spikes during those events.
2. Institutional adoption and VC backing
Both Solana and Avalanche have benefited from venture capital and institutional attention, though in different ways.
- Solana saw VC money flowing in during its NFT surge, creating stronger bullish outlooks.
- Avalanche attracted institutions testing tokenized assets and subnet architecture.
When institutional flows overlap, their correlation strengthens. But when capital favors one project more heavily (say, Solana’s NFT hype vs Avalanche’s DeFi tokenization), correlation weakens.
3. Shared ecosystems: NFTs, DeFi, gaming
Another factor? The ecosystems themselves.
- DeFi protocols: Liquidity often rotates between Solana and Avalanche. Investors chasing yield create synchronized moves.
- NFTs: Solana dominated NFT headlines, while Avalanche lagged. This divergence weakened correlation during peak NFT mania.
- Gaming transactions: Avalanche’s subnets allow tailored game environments, while Solana pushes for low-cost, fast in-game payments. When gaming hype grows, both benefit, tightening correlation.
Here’s a quick table to summarize ecosystem impacts:
| Ecosystem Driver | Effect on Solana | Effect on Avalanche | Impact on Correlation |
| DeFi protocols | High adoption, shifting liquidity | Strong DeFi yield appeal | Correlation strengthens |
| NFTs | Dominant role (Magic Eden, large mints) | Smaller niche | Correlation weakens |
| Gaming | Experiments in fast transactions | Subnet flexibility for games | Correlation strengthens |
4. Regulatory news & sentiment
Crypto doesn’t move in a vacuum. Headlines matter.
- Global regulations: Announcements from the SEC, EU or Asian regulators often move SOL and AVAX together.
- Exchange developments: Listings or delistings on popular cryptocurrency exchanges shift liquidity flows. Solana to Avalanche trading pairs on Binance Futures are particularly sensitive to these moves.
- Fees and accessibility: Exchange fees and converter table spreads sometimes make one asset look more appealing short-term, nudging correlation temporarily.
5. Technical innovations & competitive dynamics
Here’s where things get nerdy but important.
- Solana’s Proof of History upgrades: Every time Solana improves stability, confidence increases, boosting bullish signals.
- Avalanche’s subnets: Whenever a major subnet launches, correlation can weaken if AVAX surges while SOL drifts.
- Smart contract ecosystem growth: Both chains compete for DeFi and NFT developers. Gains on one side sometimes come at the other’s expense.
This dynamic is why traders often track solana avalanche correlation prediction models. They’re trying to figure out whether innovation creates divergence (bad for correlation) or convergence (good for correlation).
Historical examples of influence
Let’s connect this to real market events:
- 2021 NFT boom: Solana soared on NFT hype. Avalanche lagged. Correlation weakened.
- 2022 liquidity crunch: Both suffered together as BTC dominance rose. Correlation strengthened.
- Post-FTX rebuild: Solana’s recovery efforts vs Avalanche’s subnet marketing created uneven flows. Correlation was positive but patchy.
Trader strategies based on these factors
When you know what’s driving correlation, you can build strategies around it.
- Pairs trading: If NFT hype boosts Solana but leaves Avalanche behind, some traders go long AVAX and short SOL, expecting a snap-back.
- Hedging: During high BTC dominance, when correlation is strong, investors hedge by reducing exposure to both rather than just one.
- Portfolio optimization: A portfolio optimizer that includes correlation data avoids overexposing to Layer-1 blockchain risk.
Pro tip
Don’t just track correlation, layer it with volatility. If Standard Deviation spikes for AVAX data but Solana stays calmer, the correlation might look weaker than it really is. Overlaying correlation with volatility bands gives a truer picture. Some traders even use drawdown charts to pinpoint when correlation cracks under stress.
Putting it all together
So, what really shapes the solana avalanche correlation? It’s this messy mix of:
- Market tides (BTC and ETH dominance).
- Institutional flows.
- Ecosystem overlap (DeFi, NFTs, gaming).
- Regulatory headlines.
- Technical innovation.
The kicker is that no single factor rules forever. Sometimes NFTs drive the story, sometimes it’s regulation, sometimes it’s just old-fashioned hype cycles. Which makes the correlation both useful and dangerous.
Useful, because understanding it can reveal arbitrage or allocation opportunities. Dangerous, because relying too heavily on it can backfire when one of these drivers suddenly changes.
Trading Strategies Leveraging the Correlation
So now comes the part most traders really lean in for, how to actually use the solana avalanche correlation in practice. Knowing that two coins move together (or apart) is interesting on paper, but what does it mean when you’re staring at the chart, trying to decide if today’s solana signal is worth following?
The truth is, correlation trading isn’t magic. It’s more like… careful observation mixed with a willingness to accept imperfection. Sometimes the strategies work beautifully, other times they misfire. But if you understand the patterns and tools, you can tilt the odds in your favor.
Let’s unpack a few of the approaches traders use.
1. Correlation trading basics
At its simplest, correlation trading means comparing how Solana (SOL) and Avalanche (AVAX) move together and then positioning based on that relationship.
- Positive correlation: If both coins generally rise and fall in sync, you might treat them as one asset class for certain trades.
- Negative correlation: If one tends to rise when the other falls, traders can hedge by holding both.
- Neutral correlation: When the link is weak, they behave more independently, opening the door to diversification.
Most traders measure this with rolling correlation metrics 30-day, 60-day or 90-day periods are common. And here’s the kicker: correlation isn’t static. It shifts as new events, liquidity flows, and technical market indicators shake things up.
2. Arbitrage opportunities
Arbitrage is where things get a little exciting. This is when Solana and Avalanche prices briefly diverge more than they “should” and traders step in to profit from the misalignment.
Example:
- Solana daily analysis shows SOL pumping 5% in a single session.
- Avalanche, historically correlated, lags and moves just 2%.
- If the solana avalanche correlation prediction suggests they usually move closer together, a trader might buy AVAX expecting it to “catch up” or short SOL expecting it to cool down.
It’s not foolproof, but in highly liquid environments like Solana to Avalanche on Binance Futures, even small divergences can be traded quickly.
Pro tip:
Always consider exchange fees before jumping on arbitrage trades. A tiny gap in prices might disappear once you factor in spreads, withdrawal costs or trading commissions. A converter table of popular exchanges and their lowest exchange rates can help spot where the profit is real and where it’s just a mirage.
3. Pairs trading
Pairs trading is like arbitrage, but slower and more deliberate.
Here’s how it works:
- Identify a trading pair (in this case, SOL and AVAX).
- Track their historical correlation over, say, 90-day periods.
- Wait for a divergence from the “normal” relationship.
- Go long on the undervalued coin, short on the overvalued one.
So if Solana price prediction today is signaling strength, but AVAX data shows weakness, you’d balance by holding both positions. The idea isn’t necessarily to profit from absolute price moves, but from the spread between them closing.
Pairs trading is especially handy in sideways or choppy markets when bullish outlooks aren’t clear.
4. Hedging strategies
Not every trader is trying to be clever. Some just want protection. Hedging with correlation is a simple way to reduce risk.
- If Solana’s volatility spikes, you might hedge by holding some Avalanche, assuming their correlation will stabilize losses.
- During high BTC dominance phases (when everything tends to move together), hedging across SOL and AVAX isn’t as effective. But in neutral phases, it can cushion shocks.
Think of it as a portfolio optimizer in practice: balancing correlated assets to manage drawdown risk.
5. Swing trading divergence
Another way correlation comes in handy is with swing trading. When you see one asset break away from the correlation trend, it can be an early warning of a trade setup.
For example:
- Solana’s technical indicators form a descending wedge pattern, hinting at a breakout.
- Avalanche doesn’t show the same setup yet, but historically follows Solana’s trend.
- A trader might enter Avalanche early, expecting the move to ripple across.
This isn’t about perfection, sometimes the lag never materializes but when it does, you catch the move before the crowd.
6. Tools and platforms
If you’re thinking this all sounds like a lot to track manually, you’re not wrong. That’s where platforms and tools come in.
- Correlation calculators: Simple apps that crunch Pearson or Spearman coefficients on asset pairs.
- Portfolio tools: Some include built-in Sharpe Ratio calculators, Standard Deviation checks and drawdown charts, layering correlation with risk metrics.
- AI trading agents: Increasingly popular for monitoring solana avalanche correlation prediction models in real time, especially for fast-moving Binance Futures trading.
- Charting software: Color plotting correlation overlays on SOL and AVAX price charts can make patterns visually obvious.
Sample strategy comparison table
Here’s a quick look at how strategies differ:
| Strategy | Timeframe | Goal | Risk Level | Best Used When |
| Arbitrage | Very short (minutes–hours) | Exploit price inefficiencies | Low (fees matter) | High liquidity, small divergences |
| Pairs Trading | Short to medium (days–weeks) | Profit from spread reversion | Medium | Correlation historically strong |
| Hedging | Medium to long | Reduce portfolio risk | Low–Medium | Neutral correlation phases |
| Swing Trading | Medium (days) | Catch lagging moves | Medium–High | One asset breaks correlation trend |
Additional things to keep in mind
- Volatility matters: Correlation without considering volatility can mislead. AVAX price pumps, for example, can distort the picture.
- Liquidity flow: Popular exchanges and trading pairs can suddenly shift correlation dynamics. If liquidity dries up on one, correlation weakens.
- Community influence: Sometimes even a community-driven RebelSatoshi platform announcement or Unlock War event can create buzz around one asset, shaking up correlation temporarily.
Pro tip
Never rely solely on correlation. Layer it with other technical market indicators like RSI, MACD or even sentiment tools. A solana coin price prediction today based only on correlation is basically guessing. But combine correlation with signals, historical prices and critical levels for confirmation… and suddenly it feels less like a gamble and more like a strategy.
Final reflection on correlation trading
Correlation trading is like having a compass in a storm. It doesn’t tell you exactly where the ship will land, but it keeps you from spinning in circles. Solana and Avalanche will keep pulling closer, then drifting apart, shaped by liquidity, ecosystems and the larger crypto tide.
Some days the relationship offers clean, tradable signals. Other days it’s just noise. But if you’re patient, cautious and willing to dig into solana avalanche correlation prediction tools, there’s genuine profit potential hiding in the patterns.
And maybe that’s the point. Not to chase every move but to listen carefully to how these two Layer-1 blockchains echo each other… and then act when the rhythm shifts.
Investment Opportunities Revealed

Trading correlation between Solana and Avalanche is one thing… but investing? That’s a slightly different game. Investors think in longer cycles, with different priorities, stability, diversification, staking yields, maybe even the dream of holding through the next big bull run. The solana avalanche correlation still matters here, but the way you use it changes.
You’re not just watching minute-by-minute divergences. You’re asking bigger questions: Are these assets complementary? Are they rivals? Do they actually protect each other in a portfolio or do they sink and rise together?
And somewhere in all that, there might be profit opportunities that aren’t obvious at first glance.
1. Complementary or rivals?
Let’s start with the elephant in the room. Solana and Avalanche are both Layer-1 blockchains. Both promise scalability, speed and low-cost transactions. Both want to lure developers into their smart contract ecosystem.
So does it even make sense to hold both?
- Complementary case:
If you believe in a multi-chain future, SOL and AVAX might complement each other. Solana shines in NFTs and fast retail transactions. Avalanche thrives in institutional DeFi and subnet experiments. Together, they give exposure to different niches of decentralized finance and game transactions. - Rival case:
If you think only a few Layer-1s will dominate long-term then maybe they’re direct competitors. In that case, correlation could be a warning. If one starts outperforming, the other might lose market share.
Investors on forums (like solana avalanche correlation reddit threads) often split down this line. Some treat them as partners in a portfolio, others think holding both is redundant.
2. Portfolio diversification benefits
The big question: does holding SOL and AVAX actually diversify your portfolio?
That depends on the strength of their correlation.
- Strong correlation (close to +1): Owning both doesn’t add much protection. They’ll rise and fall together.
- Weaker correlation (closer to 0): Now you’re getting true diversification. One asset might offset the other.
- Negative correlation (rare in crypto): That would be the holy grail for investors, but SOL and AVAX rarely move in opposite directions for long.
A portfolio optimizer might calculate Sharpe Ratio improvements when mixing SOL and AVAX with BTC, ETH and stablecoins. The drawdown chart usually tells the fuller story: correlation gives you smoother returns only if it weakens during market stress.
Here’s a table to visualize portfolio outcomes:
| Scenario | Correlation Strength | Portfolio Effect | Example Outcome |
| High correlation (0.8+) | Strong link | Limited diversification | Both drop hard in a bear market |
| Moderate correlation (0.4–0.6) | Partial link | Some diversification | One recovers faster than the other |
| Low correlation (<0.3) | Weak link | Good diversification | Holding both balances drawdowns |
3. Staking & yield opportunities
One often overlooked angle? Staking.
- Solana staking: Delegators earn rewards by staking SOL with validators. Current SOL yields fluctuate but staking adds a steady layer of return.
- Avalanche staking: AVAX staking is flexible, especially when combined with subnets or institutional DeFi projects.
For investors, correlation matters less here, the question is whether staking both creates a smoother yield curve. If SOL crashes but your AVAX staking rewards stay steady, you’re not panicking as much.
4. When correlation helps… and when it hurts
Not every correlation is good for investors.
- Helpful correlation: During broad market rallies, strong correlation means SOL and AVAX both pump, giving you amplified upside.
- Dangerous correlation: In crashes, that same correlation wipes out both positions together.
This is where asset allocation matters. Some investors blend SOL, AVA, and a few negatively correlated assets (like stablecoin yield farms or BTC pairs) to balance the portfolio.
5. Case studies of correlation-based portfolios
Let’s make this less abstract.
- Case 1: 2021 bull run
Investor A held both Solana and Avalanche. Because correlation was positive and strong, their portfolio doubled quickly. The flip side? Drawdowns also hit both at once in corrections. - Case 2: 2022 crash
Investor B assumed holding SOL and AVAX would protect them. But correlation spiked during the crash, so both sank together. Lesson: correlation isn’t always your friend. - Case 3: Post-FTX rebuild
Investor C tracked the correlation carefully. They noticed Solana rebounding faster than Avalanche in certain 90-day periods. By tilting allocation toward SOL when it showed a positive trend, they improved returns.
The point? Correlation isn’t static. A flexible investor adjusts their weights instead of assuming yesterday’s correlation will last forever.
6. Long-term thesis
So what’s the bigger picture for long-term investors?
- If you’re betting on a decentralized, multi-chain future… owning both SOL and AVAX gives exposure to different innovation paths.
- If you’re cautious, track correlation closely with historical prices and technical indicators. Rebalance when correlation spikes too high.
- If you’re adventurous, you might even look at newer plays like the community-driven RebelSatoshi platform or Unlock War events for diversification, though that comes with higher volatility levels.
The future outlook depends on whether both ecosystems can keep evolving without tripping over each other.
Pro tip
When building an investment thesis around solana avalanche correlation prediction, don’t just rely on crypto only tools. Compare correlations with traditional assets too. Sometimes SOL and AVAX both weaken while equities rally. Adding that context helps you spot whether crypto is truly diversifying your portfolio or just adding more risk.
Putting it together
Investment opportunities with Solana and Avalanche don’t come from blindly buying both. They come from:
- Watching their correlation like a risk gauge.
- Using staking to add steady returns.
- Rebalancing during divergence phases.
- Treating them as complementary bets only if you believe in the multi-chain narrative.
It’s not glamorous, but sometimes the smartest move is simply to use correlation as a warning light. If it’s flashing red, both coins too tied together, step back, diversify further, maybe even wait for a clearer level for confirmation before adding more.
Because in the end, correlation isn’t just about profits. It’s about protection too.
Risks & Challenges
By now, the solana avalanche correlation might sound like a powerful compass for both traders and investors. But here’s the uncomfortable truth: it’s not a silver bullet. Correlations can mislead you, vanish overnight or lull you into a false sense of security. And crypto being what it is, volatile, unpredictable, sometimes even absurd, the risks are never far away.
Let’s unpack a few of the big challenges.
1. Overreliance on correlation
This one feels obvious but it’s the trap most people fall into. You see a correlation coefficient of 0.7 between Solana (SOL-USD) and Avalanche (AVAX-USD) and think, “Perfect, I’ll hedge with one against the other.” Then a week later, news hits, maybe Solana outages, maybe AVAX price pumps and the correlation collapses.
Correlation is descriptive, not predictive. It tells you how two assets have moved together in the past, not how they’ll behave tomorrow. A solana avalanche correlation prediction model might look impressive on paper but in practice, sudden shifts can break the trend in an instant.
2. High volatility risk
Altcoins live and die by volatility. Solana coin price prediction today might show a bullish outlook, while Avalanche’s technical market indicators flash bearish. That noise makes correlation data messy.
- Standard Deviation spikes: AVAX data can show extreme swings, pulling correlation metrics out of sync.
- Drawdown chart distortions: One sharp drop in SOL or AVAX can skew correlation readings for 30-day or 90-day periods.
- Additional volatility levels: When markets heat up (NFT boom, regulatory panic), correlation often weakens just when traders rely on it most.
For investors, this volatility risk is amplified if they think holding both equals diversification. Sometimes, it just means you’re doubling exposure to Layer-1 blockchain shocks.
3. Network-specific issues
Correlation can hide the fact that each project has its own quirks and weaknesses.
- Solana outages: For all its speed and Proof of History innovation, Solana has a history of downtime. A single outage can tank investor sentiment overnight, breaking correlation with Avalanche.
- Avalanche scalability challenges: While subnets are powerful, adoption has been uneven. Institutional trials sometimes stall, leaving AVAX lagging.
These aren’t just technical hiccups, they feed directly into market perception. And perception is what correlation really tracks.
4. Regulatory uncertainty
The regulatory cloud hanging over crypto makes correlation fragile.
- A headline about the SEC targeting staking could sink both SOL and AVAX at once, strengthening correlation in the worst way.
- A region-specific crackdown (say, on one popular cryptocurrency exchange) might hit Solana harder if its trading pair liquidity is concentrated there, while Avalanche weathers the storm.
Either way, relying on correlation without factoring in regulation is a dangerous shortcut.
5. Exchange and liquidity risks
Even the way you access these coins adds layers of risk.
- Exchange fees: Tiny arbitrage spreads often vanish once you include fees. A converter table showing lowest exchange rates and popular conversion amounts is essential before acting on correlation-driven trades.
- Liquidity mismatches: Solana to Avalanche on Binance Futures is liquid, but not all pairs are. On smaller exchanges, slippage can distort correlation.
- Popular exchanges concentration: If one platform suddenly halts withdrawals, correlation breaks, not because of fundamentals but because of technical access issues.
6. Misreading technical indicators
Correlation alone doesn’t confirm a trade. Yet people often skip technical confirmation.
Imagine: you see correlation weakening, assume an opportunity, and jump in. But if the descending wedge pattern in Solana hasn’t broken yet, or if AVAX’s critical level for confirmation hasn’t been reached, you’re basically gambling.
Correlation should guide you… but technical market indicators should confirm you.
7. Portfolio-level risks
At the portfolio level, correlation can trick you into thinking you’re safer than you really are.
- Asset allocation illusions: Holding both SOL and AVAX feels diversified, but if correlation is strong, you’re still highly exposed to the same ecosystem.
- Sharpe Ratio misreads: Correlation might temporarily improve your Sharpe Ratio, but if historical prices shift quickly, the ratio collapses.
- Risk-free rate assumption: Correlation studies often assume a stable risk-free rate, but in real markets, volatility changes the math.
This is why seasoned investors layer correlation with portfolio optimizer tools, drawdown charts, and even scenario testing.
Pro tip
Whenever you analyze solana avalanche correlation prediction, always stress test it against a bad week. Ask yourself: “If SOL drops 20% in two days due to a network outage, how does AVAX realistically react?” Build that into your plan before you put money on the line.
8. Psychological risks
Not everything is technical. There’s also the risk of overconfidence. Traders see correlation tables, color plotting charts and think they’ve cracked the code. But crypto markets thrive on unpredictability. A community-driven announcement (like RebelSatoshi’s Unlock War event) can shake things up, pulling one asset out of sync entirely.
It’s easy to forget correlation is just one tool, not the whole toolbox.
Putting it all together
The risks and challenges of solana avalanche correlation come down to this: it’s useful, but fragile.
- Overreliance leads to blind spots.
- Volatility distorts readings.
- Network outages and regulatory shocks create sudden breaks.
- Liquidity, fees, and exchange quirks make opportunities vanish.
If you treat correlation as a guide rather than a guarantee, you’re on safer ground. But if you lean on it too heavily, the very thing you thought would protect you can turn against you.
That’s the paradox: correlation is both a signal of opportunity and a reminder of risk. And the investors who survive longest are the ones who keep that contradiction in mind.
Future Outlook: Solana & Avalanche
Trying to guess the future in crypto is… well, a bit like trying to predict the weather two weeks out. You can see trends, patterns and even scientific forecasts, but there’s always a chance of sudden storms. That said, the solana avalanche correlation does give us some hints about what might lie ahead. If you watch it closely, it tells you not just how these coins move today, but how they might interact in the next bull run or during another market reset.
1. Will correlation strengthen or weaken?
That’s the million-dollar question.
- Case for stronger correlation:
If Bitcoin dominance rises again, history suggests most altcoins including SOL and AVAX, move together. Institutional adoption trends could also pull them closer, as big funds tend to treat Layer-1 blockchain assets as one “basket.” - Case for weaker correlation:
If Solana keeps expanding its NFT and DeFi ecosystem while Avalanche doubles down on subnets and institutional tokenization, their paths could diverge. That would weaken correlation, especially in 90-day periods where one asset outpaces the other.
For traders, this uncertainty creates opportunities. For long-term investors, it creates caution.
2. Expert predictions on SOL & AVAX
Analysts aren’t shy about making bold calls:
- Some see Solana coin price prediction today flashing bullish, fueled by faster adoption of DeFi apps and game transactions.
- Others highlight Avalanche’s subnet advantage and argue AVAX price pumps will become more frequent once institutions go deeper into tokenized finance.
The solana avalanche correlation prediction varies depending on which expert you ask. On Reddit, some traders even joke that correlation is “just vibes until it isn’t.” There’s truth in that the future may depend as much on narrative as on numbers.
3. Interoperability and multi-chain ecosystems
One key trend shaping the future is interoperability.
- Bridges and converters: If moving from Solana to Avalanche becomes as easy as swapping tokens with low exchange fees, their ecosystems will overlap more, strengthening correlation.
- Multi-chain apps: Developers are increasingly building apps that span multiple chains. If one dApp works on both Solana and Avalanche, usage flows could synchronize.
- Community-driven platforms: Projects like RebelSatoshi’s Unlock War remind us that community buzz can ripple across chains, especially when narratives link ecosystems together.
If the crypto world evolves into a truly multi-chain environment, Solana avalanche correlation may become more stable.
4. Competitive dynamics
On the other hand, let’s be honest, Solana and Avalanche are also competitors.
- Solana’s edge: Proof of History and blazing-fast transactions make it appealing for retail apps and NFTs. If outages decline, Solana could outpace competitors with a bullish outlook.
- Avalanche’s edge: Subnets give it flexibility no other Layer-1 quite matches. Institutions experimenting with tokenized assets often find AVAX’s architecture more attractive.
So while they might move together on broad market sentiment, at the competitive level they’re still rivals. This rivalry could weaken correlation when one network scores a big adoption win.
5. Scenarios for profit
Looking ahead, investors and traders can sketch out a few possible scenarios:
| Scenario | What Happens | Impact on Correlation | Profit Angle |
| Broad bull run | BTC, ETH, altcoins surge | Correlation strengthens | Hold both SOL & AVAX for amplified gains |
| Sector divergence | NFTs pump on Solana, institutions favor AVAX | Correlation weakens | Pairs trading and arbitrage opportunities |
| Regulatory crackdown | SEC or EU targets staking | Correlation spikes (both drop) | Short-term hedging or exit early |
| Multi-chain boom | Apps span both chains | Correlation stabilizes | Long-term portfolio diversification |
Each scenario offers a different way to use correlation, either as a tool for trading signals or as a guardrail for long-term allocation.
6. The role of technical analysis in future outlook
Even in the long term, traders will still lean on technical market indicators.
- A descending wedge pattern on Solana could hint at breakout potential.
- Avalanche’s critical level for confirmation might act as the trigger for capital rotation.
- Combining historical prices with correlation overlays and color plotting can help spot which asset is “leading” in the relationship.
Future outlook isn’t just macro-level speculation. It’s also about noticing when technicals align with correlation shifts.
7. Will one outperform the other?
This is the uncomfortable part. If history is any guide, it’s unlikely Solana and Avalanche will both dominate equally forever.
- Solana might outperform if NFTs and retail dApps keep driving adoption.
- Avalanche might outperform if institutional DeFi becomes the dominant narrative.
That doesn’t mean one dies while the other thrives. It could simply mean correlation weakens, creating periods where holding both no longer feels redundant but rather strategic.
8. Beyond 2025: What to watch
If you’re planning more than just a quick swing trade, here are a few things worth keeping an eye on:
- Network stability: Solana outages vs Avalanche subnet scalability.
- Adoption signals: Where are developers building? Where is liquidity flowing?
- Macro conditions: How does the crypto market behave if rates fall or if regulation shifts?
- Correlation volatility: Not just average correlation, but how often it swings. Stability might be just as valuable as strength.
Pro tip
Don’t just ask, “Will Solana outperform Avalanche?” A smarter question is, “What does their relationship look like in different market phases?” Track correlation across 30-day, 60-day and 90-day periods. If you notice that divergence consistently appears after big AVAX announcements, you’ve uncovered a repeatable trading edge.
Putting it together
The future outlook for Solana and Avalanche is less about choosing winners and losers and more about understanding how their paths intersect.
- If correlation strengthens, owning both amplifies gains but also magnifies risks.
- If correlation weakens, it creates fertile ground for arbitrage, pairs trading and rebalancing strategies.
- If interoperability grows, both may thrive in tandem, offering investors genuine diversification.
At the end of the day, the Solana avalanche correlation is less of a static number and more of a moving story, one that shifts with ecosystems, narratives and market tides. And if you stay alert to that story, profit opportunities won’t just be revealed… they’ll almost feel like they’re calling your name.
Conclusion
When you step back and look at everything, the Solana avalanche correlation isn’t just a quirky chart pattern or another number to throw into a portfolio optimizer. It’s more like a lens. A way of seeing how two fast-moving ecosystems breathe together, sometimes in sync, sometimes not at all.
And maybe that’s the real takeaway here. Correlation isn’t fixed. Some days, Solana’s sharp rallies, like the kind you see in solana daily analysis updates, dominate the headlines. Other days, Avalanche grabs the spotlight with AVAX Price Pumps or a new institutional subnet launch. In those moments, correlation bends or even breaks. Yet over the long haul, it keeps snapping back, reminding us these are not isolated assets floating in space.
For traders, that means opportunity. If you’re watching closely, you can catch divergence trades, hedge your positions or spot a solana signal before the rest of the crowd reacts. For investors, it’s about balance. Understanding correlation helps decide whether holding both assets is redundant or whether their occasional independence adds value to your portfolio.
The big lessons
Here’s what stood out while digging through historical prices, volatility data and a few late-night threads on solana avalanche correlation reddit:
- Correlation is cyclical. It rises during market-wide fear or euphoria and weakens during niche adoption surges.
- Macro trends matter. BTC dominance, regulatory news and global liquidity shifts can tighten or loosen the relationship almost overnight.
- Use correlation wisely. As a trading signal, it works best when combined with technical market indicators like descending wedge pattern setups or a critical level for confirmation. As an investment guide, it’s most useful for asset allocation and avoiding overexposure.
Profit opportunities revealed
If you’ve made it this far, you already know the headline isn’t hype. Profit opportunities are absolutely real:
- For short-term traders: Arbitrage on trading pairs, hedging with Solana to Avalanche on Binance Futures and spotting volatility mismatches.
- For medium-term swing traders: Using correlation overlays on drawdown charts to predict when divergence might snap back.
- For long-term investors: Treating SOL and AVAX as complementary pieces of a decentralized finance puzzle, not mutually exclusive rivals.
The trick, of course, is discipline. Don’t overestimate correlation. Don’t assume today’s numbers will hold tomorrow.
Final Thoughts
I’ll admit… sometimes staring at these charts feels a little like overthinking. But then I remember sitting in a café, watching someone scroll through a converter table on their phone, trying to compare exchange fees for Solana in Avalanche. They weren’t pro traders. Just a curious newcomer, dipping into the world of crypto. And it reminded me: correlation, technicals, even Sharpe Ratio calculations, all of it only matters if it helps real people make sense of their choices.
So maybe the smartest move isn’t predicting every twist but staying curious. Watching how correlation shifts, learning from it and letting it guide decisions without being chained to it.
FAQs
Here are some questions people casually ask when they bump into this topic, the sort of things you’d hear over coffee rather than in a lecture hall.
Is Solana really correlated with Avalanche?
Yeah, most of the time. Their prices often move in the same direction, though strength varies depending on market mood.
Which is better long-term: SOL or AVAX?
Depends what you want. Solana shines in NFTs and speed, Avalanche in subnets and institutional adoption. Many just hold both.
How do I check correlation myself?
Look at rolling correlation charts, or even simple trading pair data. Binance Futures has tools, and plenty of free platforms let you track it.
What does solana avalanche correlation reddit say?
Mostly jokes and quick takes. But sometimes you find traders sharing charts and noting patterns before they hit mainstream news.
Can correlation help with solana coin price prediction today?
Not directly. Correlation is more about relationships. But if AVAX moves first, it might hint where SOL is heading.
Is this financial advice?
Nope. Think of this as a conversation, not a prescription. Always do your own research before trading or investing.
How risky is it to rely on correlation
Pretty risky if you lean on it alone. Combine it with technical analysis, portfolio diversification and risk-free rate benchmarks for context.
Does correlation stay stable over 90-day periods?
Not always. It can swing, especially during volatile news cycles. That’s why tracking multiple timeframes helps.
What tools are best for correlation trading?
Portfolio optimizers, historical price overlays and even AI trading agents. But honestly, a good charting platform plus discipline goes a long way.
Should I care if I’m just holding long-term?
Yes, at least a little. Even long-term investors benefit from knowing when two assets move too closely, so they can avoid unnecessary overlap.